Whither went the warmer weather?

Whither went the warmer weather? (2013-12-16). “17 years, 3 months with no global warming” says Anthony Watts, our all-knowing guide to the Universe. He knows this because Britain’s celebrated Morris Dancer of the intellect, Lord Christopher Monckton of Brenchley says so in his usual tangential, conspiracist, long-winded, self-delighted way. He even has a tongue-twister post title and a poem to back him up, who can beat that?

Furthermore, the Lord declares that “the models are in fundamental error”, trying to imply that conventional climate science is somehow wrong. As usual he’s too busy pontificating to consider, in this case, the distinction between prediction and projection.

Monckton tops it off by jumbling the cautionary statistical aphorism “correlation doesn’t imply causation” into “absence of correlation necessarily implies absence of causation.” That’s logical mastery that rises above grimy reality!

Never mind that this November just past was the hottest ever in the GISS record, or that the HadCRUT3 warming trend is pretty glaring if your eyes are open. Look at Monckton’s data!

Wait that’s the GISS data, posted by Tamino, which kinda undermines the Lord. We only trust the RSS data! Look again:

Damn, that’s not flat! Can’t a right-thinking denialist count on Dr. Roy Spencer? Oh, his chart wasn’t playing the long game, it was just designed to boast about his UAH satellite data corrections (it’s only “fudging” when other scientists do it).

Best to stick to Lord Monckton’s own chart, with the messy contradictions and distracting numbers tucked away out of sight. Squish the scale down too and draw a nice thick flat line on it:

Monckton 20131216 RSS chart

Now that’s useful science!

Antarctic warming courtesy of Mr. Fix-it

Antarctic warming courtesy of Mr. Fix-it (2012-12-27). Anthony Watts posts some profound scientific analysis – “Just a little something [David Middleton] threw together”.

On the basis of Middleton’s “Mk I eyeball”, careful scientific work on Western Antarctic temperature records is dismissed with a sneer as “manufactured” and denialist cooling (via squinting) replaces objective evidence of significant warming.

So David, did you just “throw it together” or just throw it up?

Here’s Anthony Watts’ own attempt to disparage the study three days earlier, in it’s entirety, supported by a cartoon of Santa’s sleigh:

They can’t find any recent warming, so they took a broken sensor with “intermittent gaps and other problems”, “recalibrated” it, “used computerized analyses of the atmosphere to fill the gaps” and “discovered” warming that “happened in the 1980s”. If you believe that this is science, then I strongly suggest you prep your telescope, lest you miss out on a spectacular sleigh sighting…

If you believe Anthony’s interested in science, you probably believe in the tooth fairy.

New study shows half of the global warming in the USA is artificial

“New study shows half of the global warming in the USA is artificial” (2012-07-29. Originally titled “PRESS RELEASE”). Here it is! The game-changing scientific announcement from Anthony Watts that the entire world will want to know about!

“U.S. Temperature trends show a spurious doubling due to NOAA station siting problems and post measurement adjustments.”

So… Anthony Watts’ science revelation is that his inkjet has finished printing a typo-ridden do-over of his attack on US surface station weather data, “to be submitted for publication”, with his usual denialist pals (McIntyre, Christie, Jones).

Strange that Anthony’s promoting his sciencey-ness before publication (let alone acceptance). Didn’t he rail against the practice when he didn’t like former pal Dr. Muller’s temperature analysis? I guess that was then and this is… now.

Let’s see who he tries to submit this too (Journal of Geophysics, anyone? Oops, all the planted editors have decamped) and how the peer-review turns out. Should be funny to watch him squirm and sputter.

Wait, I just got it!

Anthony knows the evil conspiracy of competent climate scientists will never allow  a threat to the secret communist world government. Like every denialist proclamation yet, Anthony’s moment of shining triumph will last no longer than the delay between clicking “post” and being read by tamino or RealClimate.org (that will be some good readin’).

Make hay while the sun shines, Anthony.

P.S. Looks like Anthony’s barrage was timed to deflect attention from his former denialist buddy Dr. Muller. Muller’s Berkeley Earth Surface Temperature publication confirmed the conventional scientific conclusions. His op-ed today in the New York Times is “The Conversion of a Climate-Change Skeptic”:

Call me a converted skeptic. Three years ago I identified problems in previous climate studies that, in my mind, threw doubt on the very existence of global warming. Last year, following an intensive research effort involving a dozen scientists, I concluded that global warming was real and that the prior estimates of the rate of warming were correct. I’m now going a step further: Humans are almost entirely the cause.

Anthony’s been hiding behind a fence, nursing his snowball-with-a-stone-in-it waiting for Muller to walk past. Hell hath no fury like a betrayed denialist.

2012-07-31 Update: Victor Venema (commenting here too) has some good first-pass comments on Anthony’s mediocrity. Eli Rabett has also gathered some entertaining insights into Anthony’s latest self-congratulatory own goal.

But this lack [of perspective] makes amateurs prone to get caught in the traps that entangled the professionals’ grandfathers, and it can be difficult to disabuse them of their discoveries. Especially problematical are those who want science to validate preconceived political notions, and those willing to believe they are Einstein and the professionals are fools. Put these two types together and you get a witches brew of ignorance and attitude.

Unfortunately climate science is as sugar to flies for those types.

New paper blames about half of global warming on weather station data homogenization

“New paper blames about half of global warming on weather station data homogenization” (2012-07-17). Anthony Watts eagerly embraces a “peer-reviewed paper” conference abstract that uses some garden-variety data diddling. Sez Anthony:

Authors Steirou and Koutsoyiannis, after taking homogenization errors into account find global warming over the past century was only about one-half [0.42°C] of that claimed by the IPCC [0.7-0.8°C].

Them climate scientists are manipulat’n data for their Commie bosses! Not Steirou and Koutsoyiannis…

Strange how Anthony forgets that even denialist Roy Spencer’s satellite temperature records show a 0.46°C rise in 33 years. One might think a bit of caution is in order when someone claims that only there’s been 0.42°C of warming over the last century.

Anthony Watts just types “told ya so” as fast as he can work his trembling fingers. Where’s the skepticism? Up his ass of course. He, like the paper’s authors, doesn’t seem to understand data homogenization. Here’s Dutch scientist Victor Venema on Anthony’s intentional ignorance:

A student can make an error and conferences are there to talk about preliminary results, much more worrying is that Anthony Watts keeps on getting his facts wrong. An EGU abstract is simply not a peer reviewed paper. Of the three sentences Watts cited from the “peer reviewed paper”, two can only be found in the slides of the talk, which are not reviewed. Every post on Watts up with that?that is on a topic I am knowledgeable about, contains serious factual errors and clear misrepresentations. I am not talking about having another opinion, but facts. If clear facts are already wrong, I start doubting the rest. One wonders why the readers of Watts up with that? keep on reading that stuff. There seems to be little interest in the truth among these self-proclaimed skeptics.

We’ll leave the final insight to one of Anthony’s squad of censors “moderators” who is proud of how enthusiastically and regularly wrong WUWT is:

[REPLY – What it means is that WUWT, unlike nearly all alarmist blogs, does not censor contrary points of view. Science is a very back-and-forth kind of thing. Anyone can be wrong. Anything can be wrong. Consider that. ~ Evan]

Detecting regime shifts in climate data – the modern warming regime ended in 1997

Detecting regime shifts in climate data – the modern warming regime ended in 1997 (2012-07-03). Anthony Watts blindly publishes another piece of scientific nonsense. Sam Outcalt, Emeritus (naturally) Professor of Physical Geography (naturally) has screwed around with Excel and discovered you can turn pretty much any data trend into a parabola that suits your goals if you just rescale things and only plot cumulative sums of deviations from average.

“This short analysis indicates that an alternate model of climate change based on serial regime transitions rather than anthropogenic global warming is consistent with the results of the Hurst Re Scaling analysis.”

It’s so simple! Um, too simple:

“Cumulative sums can show very interesting behavior. They can also be extremelytricky to deal with statistically. That’s not a problem for Outcalt, his post doesn’t seem to have any statistics.” – Open Mind

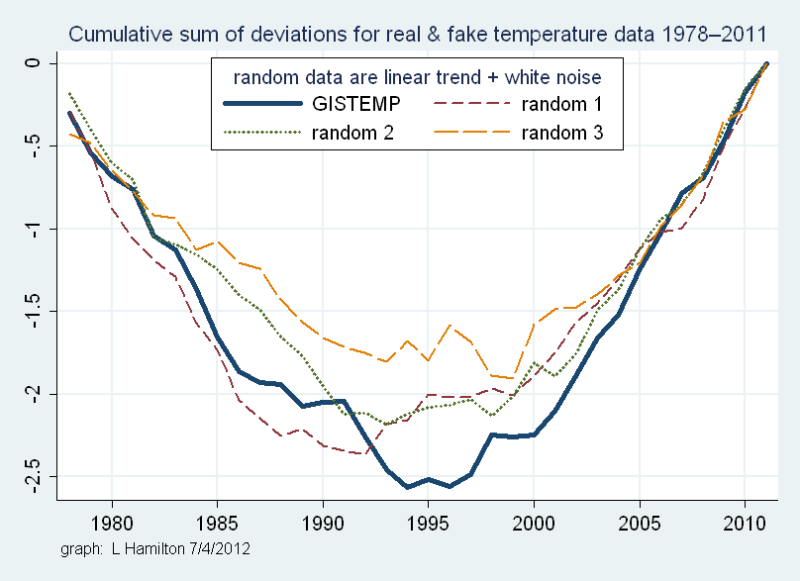
This is what fake linear temperature trends look like when plotted along side real temperature the the way Outcalt did:

Looks like Dr. Outcalt’s dunce-cap methodology turns any linear trend into a parabola that can be presented as proof that the trend has reversed…

955 words and four references (do “personal communications” really count?) are all Outcalt needs to underpin his argument. I think Anthony’s denialist blog is the pinnacle of this “paper’s” trajectory. Outcalt is a retired permafrost guy, his last paper seems to have been in 1994.

‘Ads by Google’ helpfully suggests that “If you use a spreadsheet to manage work, you should watch this helpful 1 minute video.” Maybe the good Perfessor should take Google’s inscrutable advice?

Update: Here’s a real temperature trend, from 1800 to 2010. Notice the lack of “regime change” in 1997? This data is from the Berkeley Earth Surface Temperature project, in which Anthony placed great faith until it didn’t give the result he wanted.

“So what?” you say, another emeritus academic outside of his area of expertise who thinks he’s “proved” everyone else is wrong. Dime a dozen at Watts Up With That. Well… true. But every now and then (meaning several times a week) a classic example of Anthony’s tactics comes along and gives us a useful way to deconstruct Anthony’s method:

  1. He will publish literally anything with a “conclusion” that suits his agenda, even if he has no ability whatsoever to understand it. Perhaps especially if he doesn’t understand it.
  2. He will imply that any forthcoming criticism will be malicious so that his readers will think that Anthony has the intelligence to anticipate and dismiss factual scientific criticism:

    “Great paper. Thanks for re-posting this Anthony. Hurst makes perfect sense and it is well defended in the paper. I think Tamino is over his head with a paper like this.
    REPLY: Oh, he’ll try to shoot it down anyway. – Anthony”

  3. He posts new stuff so fast that by the time anyone intelligent can respond his mesmerized audience has forgotten about it other than a few unshakable rearguard commenters. Although they will all keep a vague memory of another perfect proof, probably contradicting earlier perfect proofs, that there is no global warming, which stopped in 1997 anyway.
  4. He counts on his denialist ditto heads to repost WUWT posts so that if any intelligent analysis infects the comments of his own posts and disrupts the head-nodding the copies will remain uncorrected and continue to deceive. (Of course he’ll never correct his own post either, so that readers that don’t mine the comments will remain unaware.)
  5. His censors “moderators” will always invoke (im)plausible deniability when Anthony’s caught and will pretend his readers are up-to-date in all the physical sciences anyway:

[REPLY: Anthony publishes lots of stuff, not all of which he agrees with. It is simply “interesting”. WUWT commenters are fully capable of critiqueing the work and have done so. Anthony is not a co-author on this article and is not required to justify or explain anything, especially to anonymous individuals using anonymous proxy servers. Check site policy regarding that. -REP]

Not particularly clever, but effective if you lack peripheral vision.

Update: Anthony re-applied his denialist french kiss to Outcalt’s fake technique one day later when Outcalt sends him some rigged solar data: Another regime change indication – this time in solar data. One day the climate switch flipped in 1997, the next day the switch flipped in 2005. Just pick one and stick with! This time Anthony gets called on it too fast to slip away and pulls an “as I expected”:

UPDATE: As I expected he would, Dr. Leif Svalgaard takes exception to this characterization of the identification of October 2005 being a regime changepoint, saying:

While I agree that the sun is going quiet, the ‘step change’ is spurious. It is mainly due to a sporadic, single magnetic storm in September 2005: http://hirweb.nict.go.jp/sedoss/solact3/do?d=2005%2c09%2c04 and here is the next rotation: http://hirweb.nict.go.jp/sedoss/solact3/do?d=2005%2c10%2c01 You can find many such steps.

Such step changes happens all the time: http://www.leif.org/research/Ap-1844-now.png They are just weather, not climate.

Of course Anthony takes as “skeptical” view of the opinions of actual solar experts as he thinks can get away with:

While I defer to Dr. Svalgaard’s overall superior knowledge on the dynamics of sun, and agree there are many sharp transitions in the Ap record, this looks to me to be a step change event of merit based on the factors listed above. I’ve yet to see a fully convincing explanation that this was a spurious event rather than a regime changepoint. But, I remain open to seeing such an explanation.

NASA notes sea level is falling in press release – but calls it a “Pothole on Road to Higher Seas”

NASA notes sea level is falling in press release – but calls it a “Pothole on Road to Higher Seas” (2011-08-24). Anthony Watts reminds his readers that if an increase doesn’t happen every single year then it’s not happening. And a NASA press release admits that sea-level didn’t rise in 2010! You’d think after all the denialist accusations them gubmint scientists would be better at falsifying observations to prove whatever they wanted.

So the slight reversal of sea-level increase (which was not happening anyway) means that sea-level rise has stopped (even though it wasn’t happening anyway). Therefore humanity’s CO2 emissions, which don’t cause warming, are not causing climate change (which isn’t happening anyway). Got it?

So we have years of Anthony and his pals claiming that rising temperatures and sea-level are all down to various vague and supposedly cyclic natural causes and definitely not man-made causes. Of course actual scientists have always factored in natural influences and have studied them in great depth to determine their contributions. But here the natural causes are suddenly discounted by the denialist arm-chair critics.

Willis Eschenbach adds a deep scientific insight by noting that Greenland received more precipitation than usual in 2010, so it’s glaciers are apparently not in danger after-all, thus disproving global warming once and for all. Willis somehow didn’t notice that the satellite precipitation data is considered incorrect for that region… And his analysis of NASA’s discussion of the causes of the dip in sea-level dispenses with even a cocktail napkin this time around. Sounds like he’s talking about himself when he pontificates:

When people make claims like that, with no numbers attached, my Urban Legend Detector™ goes off like crazy … and in this case, it was right.

Analysing the complete hadCRUT yields some surprising results

Analysing the complete hadCRUT yields some surprising results” (2011-08-04). Anthony Watts learns from a post by right-wing “Global Warming Policy Foundation” lobbyists about a post by Luboš Motl that proves that 30% of the Earth has cooled. Run from the Ice Age! Or something like that.

After five years of denialist pretense that the data was being hidden from them (because they had to go to the trouble of requesting it from the various national meteorological organizations that owned it) the unified release of the global data set used by the Climate Research Unit at the University of East Anglia has forced them to switch to a new fake numbers game. Expect a lot more of this kind of transparent misdirection, designed to keep the uninformed public distracted. Expect Anthony to make a big fuss about it each time.

Luboš Motl's plot of HADCRU3 data showing historical warming or cooling trend.

Look at how much of that cRaZy blue there is!

So if we are to believe Motl, the Earth is actually 30% cooler than it was 77 years ago. Run from the Ice Age! No wait; some places have cooled even though most other places have warmed, so it’s not global warming. No wait, it’s that the HadCRUT3 temperature data comes from weather stations that only represent particular small areas, so it can’t tell us anything about global temperature. (Dang! They should have just used that one temperature station that records the whole planet.)

Err, maybe this is why scientists use statistics? To collect and objectively interpret large data sets with complex trends and arrive at an objective understanding.

Hold on. Is Motl really trying to make the point that unless every station shows a warming trend then we can’t claim that there is global warming? Is his point really so dogmatically stupid? Maybe, because in spite of his self-declared brilliance Motl has to admit that he got “standard deviation” mixed up with “root mean square“. Unfortunately he says “I don’t have the energy to redo all these calculations – it’s very time-consuming and CPU-time-consuming” but I’m sure it’s a wash, huh?

Anthony Watts and the “Global Warming Policy Foundation” are certainly happy to overlook this, because to them the fact that 30% of the recording stations show a cooling history apparently makes their heads reel. Not climate scientists however. Only an idiot would expect a trend to be uniformly expressed throughout a complex natural system.

Oh, that’s right. We’re talking about Anthony Watts, aren’t we?

“Earth itself is telling us there’s nothing to worry about in doubled, or even quadrupled, atmospheric CO2″

Earth itself is telling us there’s nothing to worry about in doubled, or even quadrupled, atmospheric CO2 (June 2, 2011). According to Anthony Watts, Pat Frank writes excellent essays on climate science. The beaming Anthony helpfully offers a new example of his excellence, copy-and-pasted from his echo chamber partners at The Air Vent: “Future Perfect“, which asserts this comforting “fact”:

Spread the word: the Earth[‘s] climate sensitivity is 0.090 C/W-m^-2. [This of course begs the question: how did the Earth ever enter or leave an Ice Age in the geological past?]

Anthony Watts and his readers embrace Frank’s dim-witted numerology wish-fulfillment with surprisingly open arms. Frank’s conclusion (based on his intuitive grasp of climatology?) is that all this alleged warming is somehow merely the recovery from the Little Ice Age and that we can pump out as much CO2 as we like.

Once again Excel is put to good use, disproving those dang climatologists and their thinkin’. Nothing like invoking from thin air a “combined cosine function plus a linear trend” to explain everything, without the bother of actually explain anything. If Frank could actually explain why his magic squiggle occurred, he’d actually have something. Sadly, it’s clear that he simply pecked away at Excel until he stumbled across an equation that sort-of matched the historical record.

More of a citizen-scientist’s mind at work: “The rest of the analysis automatically follows.”

Pat Frank discovers that Excel can draw flat lines.

My “technical analysis”: Frank has discovered that if you subtract a bunch of numbers from themselves you get zeros!  You’ll aways get a flat line when you plot a squiggle that’s a pretty close fit to the data and then remove the squiggle.

Tamino at Open Mind lays out how a sentient person might respond to such nonsense, first with the quick double-take post Circle Jerk and in more detail with Frankly, Not.

Some nuggets from the keenly skeptical comments at Anthony’s blog:

  • Andy G55 – “This is the sort of REAL analysis I love to see. propa science !!! well done, mate !!”
  • Shaun D – “I agree. This is real science. But I have no idea what it means.”
  • Alan the Brit – “Sound, common sense, well thought through, & logially applied, so it won’t be published in the MSM then!”
  • Ryan – “Fantastic post Mr Frank, very plausible and difficult to refute.”

Pat Frank: The New Science of Climate Change

Pat Frank: The New Science of Climate Change (May 14, 2011). Anthony Watts’ blog buddy “John A” wants us to read chemistry PhD Pat Frank’s May 6th post on Jeff Id’s blog (ah, “social networking”). It proves that Global Warming is all just fiddling by them dang lyin’ climate scientists. They adjusted the early 20th century surface temperatures upwards to create the appearance of a late-century warming trend! What sneaks.

This increase in rate wasn’t due to an accelerating late 20th century trend. It’s mostly due to modifications of the 1880-1920 record.

Wait, haven’t the denialists been claiming that early instrument records were adjusted downwards to maximize apparent warming? Could it be that they’re adjusting in both directions at once? It staggers the mind.

Pat Frank’s rigorous scientific technique is to scan the published graphics and convert them to numerical values. How this is supposed to inspire confidence in his conclusions remains unknown because Frank offers no discussion of the reasons for changing the data selection that produced the plots. I suppose that would take both knowledge of the details as well as scientific insight.

His accusation is that the earliest instrument data was ‘adjusted upwards’ by GISS  from earlier presentations to fraudulently lower the slope of early century warming and make post-1975 AGW warming look comparatively steeper. So Frank adjusts the values in the direction that suits him by cherry-picking some starting points (What’s special about 1950? Nothing.), adds in some x-axis squashing for more visual minimization, and declares victory. Now that’s post-normal.

This all boils down to more accusations of “Post-Normal Science”, which denialists like to sling about when ever climate scientists refine their theories or improve historical analyses. Any change in “the record” is malicious don’t you know.

I wonder why Frank doesn’t discuss Total Solar Irradiance, which was increasing during the early part of the century and level later in the century when all the Global Warming happened? After-all he does make a half-hearted stab at blaming the warming on “solar variation”.

The surfacestations paper – statistics primer

The surfacestations paper – statistics primer (May 12, 2011). Was Anthony Watts hiding his light under a bushel when he announced the surfacestations paper was in press? Is this post the meaty one, and the announcement mis-fire just rope-a-dope? Heres comes co-author Dr. John Nielsen-Gammon’s science! (Apparently John, a meteorologist who is the politically-appointed “Texas State Climatologist”, came on-board after Anthony’s own statistical efforts were tossed.) [Update: apologies for following Anthony’s misspelling of his co-author’s name.]

First of all John admits a “subtle point”. It turns out they “didn’t assess the differences in individual station measurements”, which unfortunately was what Anthony had been shouting about for years. Oh really?

John also admits that “NCDC’s preliminary analysis of siting quality used a gridded analysis, but we checked and our numbers weren’t very different.” (emphasis mine). Oh really?

Another curious admission from John is that “you have to work with anomalies or changes over time (first differences) rather than the raw temperatures themselves.” This seems strange, because the denialist howling has always been that only the raw temperatures can be trusted.

Fourth, John tells us that “a station should matter more in the overall average if it is far from other stations, and matter less if lots of other stations are nearby.” Isn’t weighting stations how the mainstream climate scientists rigged the numbers? Oh dear, there’s a pattern emerging. Regular science.

What was the ingenious analysis that pulled all this together into the final nail in the coffin of global warming? The “Monte Carlo approach”.

In fact, it’s so simple you don’t need to know statistics to understand it.  Given two classes of stations whose trends needed comparing, I randomly assigned stations to each class, while making sure that the total number of stations in each class stayed the same and that each climate region had at least two stations of each class.  I then computed and stored the difference in trends.  I then repeated this process a total of 10,000 times.

Then of course you cherry-pick the few comparisons that randomly show the trend you want to claim is real and ignore the other 9,990. This is what denialist statistician-to-the-stars Steve McIntyre did in his attacks on Dr. Mann’s temperature reconstructions, and was so ham-handedly reproduced by Dr. Edward Wegman.

So what’s left? Weak mutterings about how “many stations underwent simultaneous instrumentation and siting changes” in the 1980’s. Apparently no-one knew this (not).

This paper is sounding more and more like an ass-covering way to justify several years of wasted and misguided effort. The demonized scientific process has pinned Anthony and his team like bugs under a magnifying glass, holding them accountable for every squeak. The result? Laryngitis.