“Rewriting the decline“. Anthony Watts’ friends have been down in their basement and found a 1976 issue of National Geographic with a temperature history chart of North America that looks different from current global temperature histories! Could there really be a decline in temperatures since the 1960’s that evil climatologists have tried to hide from us?
After admitting that “the global records are not available to check, it’s impossible to know how accurate or not this graph is” they proceed to make the usual speculations and accusations ( including the suitably Orwellian “history has been rewritten”) based largely on a digital photo of a squished magazine illustration. (The version I post here includes more of the original figure than the denialists revealed.)

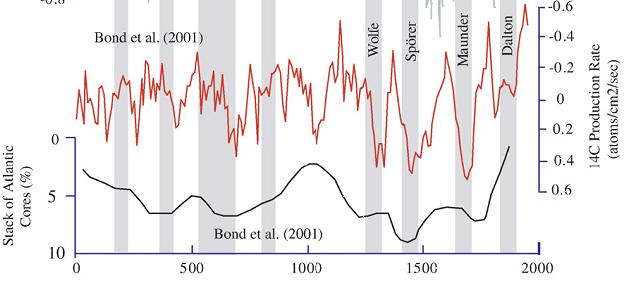
Art illustrations as scientific evidence. Note: chart in the lower left, excluded from the discussion, is apparently NOT evidence.
The j’accuse comes pretty quick: “the data had been adjusted (surprise)“, backed by this supporting evidence:
But, as usual, the adjustments were in favor of the Big Scare Campaign, and the reasons and the original data are not easy to find.
So in other words, they have no idea why the modern, global, chart differs.
Anthony compounds this ignorance as usual by failing to understand the term “accuracy”, but he really got my attention with his sudden conversion to dendrochronology.
Many tree rings showed a decline after 1960 that didn’t “concur” with the surface records. Perhaps these tree rings agree with the surface records as recorded at the time, rather than as adjusted post hoc? Perhaps the decline in the tree rings that Phil Jones worked to hide was not so much a divergence from reality, but instead was slightly more real than the surface-UHI-cherry-picked-and-poorly-sited records??
Anthony, do you really think that the temperature records were maliciously altered around the world to suit an implied political agenda? And that now we should trust the innocent, uncorrupted, tree rings?


 “
“